
Update – there is now a new version of this tool, see this article for a full rundown.
Recently I was in discussions with an AppSense TRM regarding a lot of niggly issues being seen in a particular client environment. One of the issues I had a bit of concern over was the amount of time spent logging and responding to individual support cases for each of these issues. Now I’m not denigrating the quality of support – the AppSense guys have always been helpful and accommodating – just making a point about the amount of time I was spending troubleshooting what, in some cases, turned out to be fairly minor issues. I engaged the TRM to try and find if there was any way I could do a bit of troubleshooting myself based around the AppSense Environment Manager debug logs.
I’m assuming those of you who are familiar with AppSense DesktopNow will have come across a situation where you’ve needed to turn on debug logging (discussed in this post – which might need a bit of updating, seeing as though it is from quite a while ago). The usual process is to send them off to AppSense support for perusal – but if, like I was, you find yourself trying to quickly troubleshoot a whole load of POC issues, then it might make more sense time-wise to try and interpret some of the logs yourself.
The tool that AppSense have recently released for help with reading debug logs is the EMDebug Log Parser Tool. I’m told there was a predecessor to this tool that was much less intuitive, but it’s something I never found the opportunity to use. The EMDebug Log Parser has an associated library file that needs to sit in the path, but it doesn’t need any installation besides this – the best way to run it, IMO, is to bung it on a network share and execute it as necessary.
Firstly – this won’t work unless your EM environment is at least version 8.1, but the last 8.0 I saw was a good while ago so I’m hoping there isn’t too much of that left out in the wild.
Secondly – you clearly will need some EM Debug Logs to work with! The collection of the logs was covered in an earlier post, but there’s a nifty little trick the TRM showed me to turn on EM Debug Logging from within persinfo.exe, which seems easier and quicker than the traditional method.
If you’ve got the latest version of PersInfo running – and if you’re troubleshooting an issue, chances are that you might be running it – you simply need to right-click on the icon in the notification area and select the Advanced | EM Logging | Enable option. The interface to enable it is slightly different to that you may be familiar with from the EM Debug Tool (shown below)…
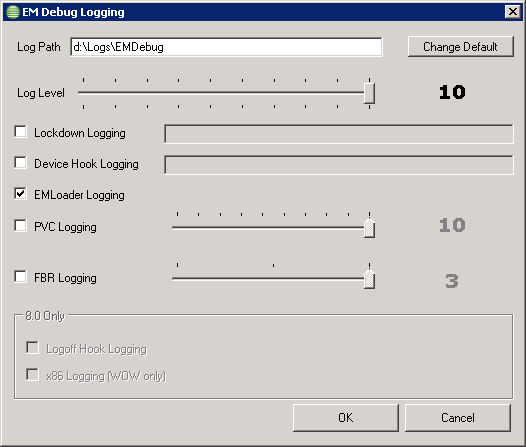
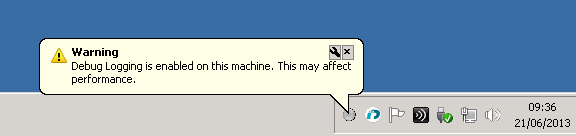
…but it should still be fairly easy to configure. You will be prompted to restart the services afterwards after which the debug should be active. If you’re using the latest version of PersInfo, you will see a handy notification in the system tray warning you that the debug is now running, and that this may impact system performance.
So now we need to generate some logs by actually logging on to the machine as an AppSense-enabled user. Once we’ve logged in (and back out, if we’re looking to capture information from the logoff process as well as the logon), it makes sense to stop the debugging in the same way that you started it, to make sure we aren’t subjecting our system to an unnecessary load. Then we can browse to the folder where we saved our logs and see what has been captured.
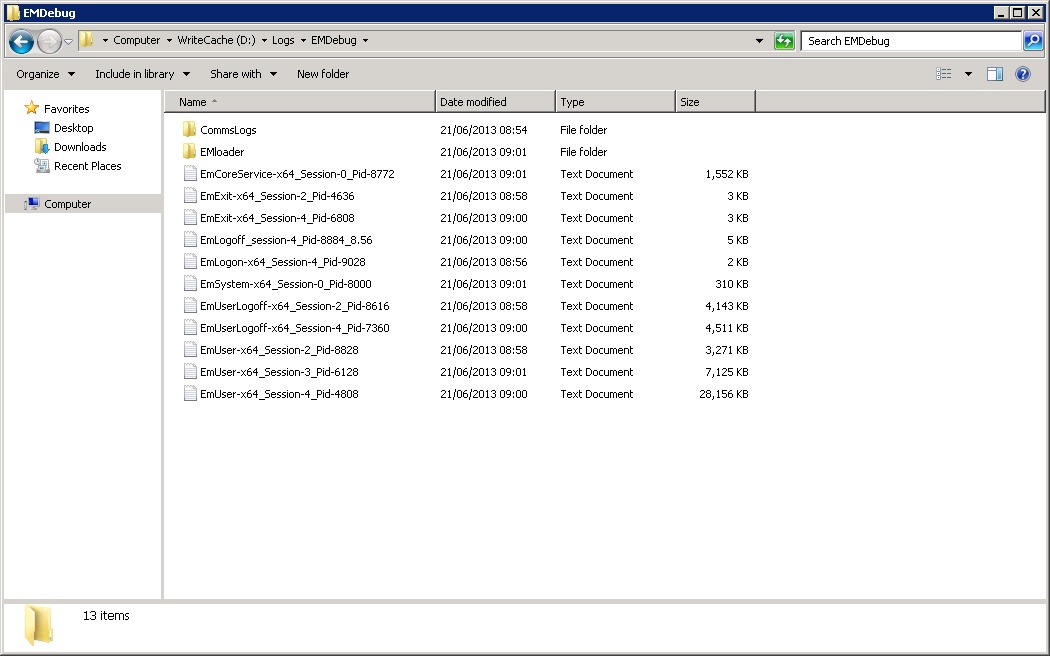
The logs are named according for the specific EM area they refer to, the session ID, and the process ID. It should be fairly straightforward to identify the one you will need to pay attention to. In this case, we are going to investigate the EMUser log from Session 5, which we know will show us the logon actions for the session I just initiated. The configuration it was running was extremely simple, verifying a username and then trying to map a drive which didn’t actually exist.
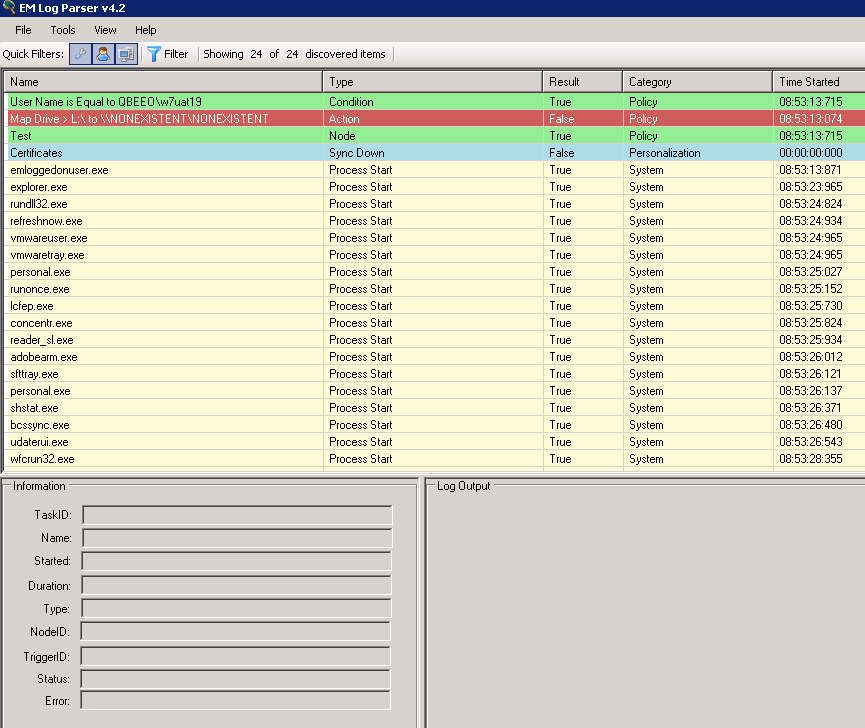
Straight away we can see the Log Parser tool gives us a lovely, colour-coded intuitive view of the log file, which is much easier to read than browsing the text file directly (don’t believe me? Give it a try). Right at the top we can see the single Condition in our node, a check for the username. Clicking on the event so it is highlighted provides us with some more detail in the bottom panes of the Log Parser window
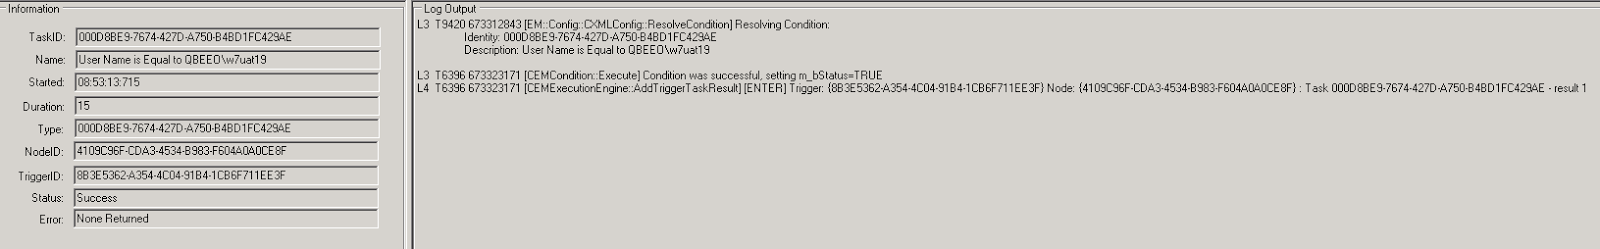
It’s easy enough to see that the check for the user’s username has passed successfully, so naturally then the next thing it tries to do is map a drive in the dependent Action. The colour-coding alone tells us that this Action has failed (as we intended it to), but we will have a look at the extra details to see if we can see any clue as to why it failed.
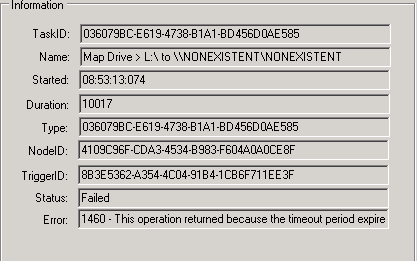
We can clearly see here the error returned of “operation returned because the timeout period expired”. So even if it wasn’t already obvious, it should now be clear that the Map Drive Action timed out trying to connect to the network path specified – because it didn’t actually exist.
After this you will see an event that logs the successful completion of the Node (even though an Action failed, the node still completed). Don’t forget that if a Node doesn’t complete successfully it should time out according to the default settings.
The last set of log entries refer to processes starting within the user session. These are logged to see if they match a Process Started Action. Obviously there weren’t any configured in our simple test configuration, so nothing else is logged subsequent to these.
So now you should be able to save an Environment Manager debug log and quickly peruse it yourself to see if anything is failing for a particular reason.
Another handy part of the EM Log Parser tool is the Timeline view on the View menu. This shows you a breakdown of the actions over a period of time, and should be very handy in identifying Actions that slow down the user’s logon.
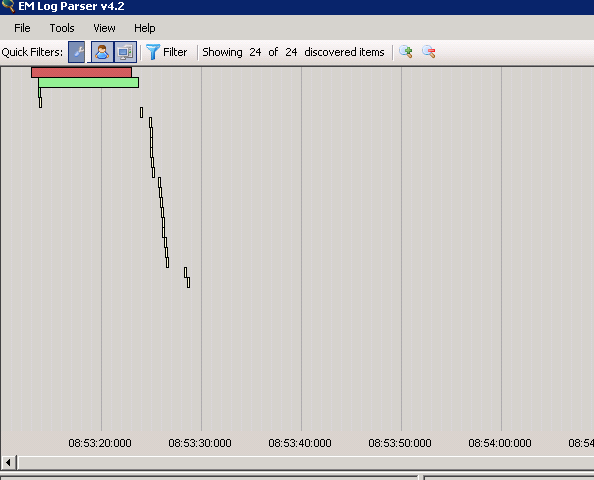
What you should look for in a good logon is a more-or-less vertical line, as shown above. Significant delays will spread the timeline view out horizontally and hopefully pinpoint any potential bottlenecks in your configuration.
The EM Log Parser tool also comes with a handy Filter function that will be familiar to anyone who has used Process Monitor at all, which is particularly useful in breaking down large and/or complex logs to target the specific area you are interested in. For instance, if I wasn’t interested in Process Started Actions, I could quite simply filter them out from the Table view.
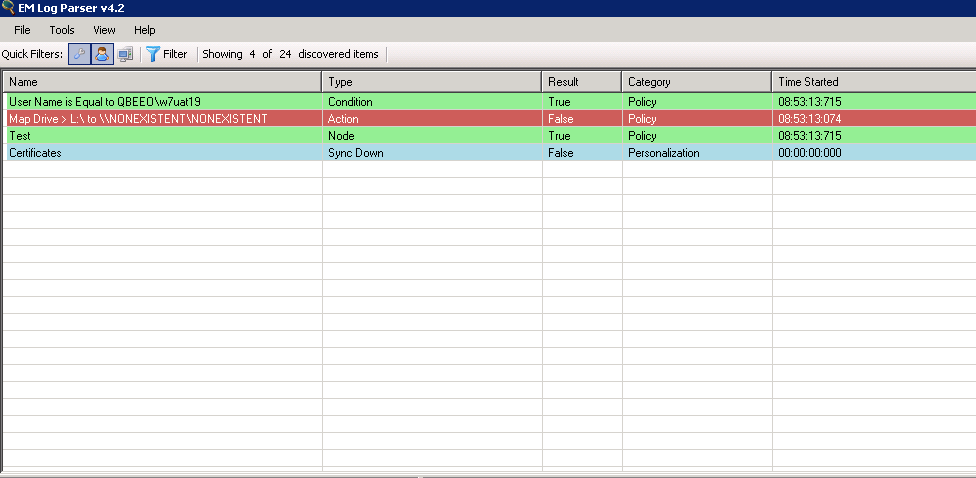
Finally, there is also a Personalization view that specifically deals with the Personalization Server aspects of a user session, and that provides information similar to that which can be gleaned from the excellent PersInfo tool.
Well, hopefully this little run-through should allow you to troubleshoot EM Debug Logs yourself to identify simple issues. Please remember, though, that if you’re in any doubt about how to resolve or approach an issue highlighted by this you should really contact AppSense support for some help, especially when working on live production environments.
Thanks to Andrew Silver of AppSense for giving me a run-through of this handy tool.