
For a long time now, AppSense administrators have had to become familiar with the EMClientDebug tool when trying to capture errors, and feeding this into the EM Log Parser for analysis. The process always felt a bit disjointed to me, particularly as the Log Parser tool had to be downloaded, and also down to the odd issue that some of the log files wouldn’t load at all. It’s a part of the AppSense interface that has been ripe for an overhaul, and with the advent of Environment Manager 8 FR 6, it’s finally received it.
The debugging tools (now called ClientLoggingSetup under the hood) still ship as part of the standard Environment Manager Tools MSI (as opposed to the Environment Manager Policy Tools, which were new in EM 8 FR 5, if I remember correctly). So firstly, you will need to install the tools onto an endpoint (although this doesn’t necessarily need to be the endpoint you’re actually going to debug, just an endpoint with the same processor architecture). Most of the time, I simply install them onto an AppSense server.
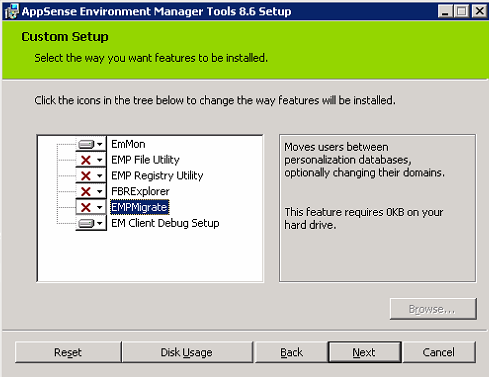
You can select just the ones you require as above, or do what I do and simply install the whole suite for posterity.
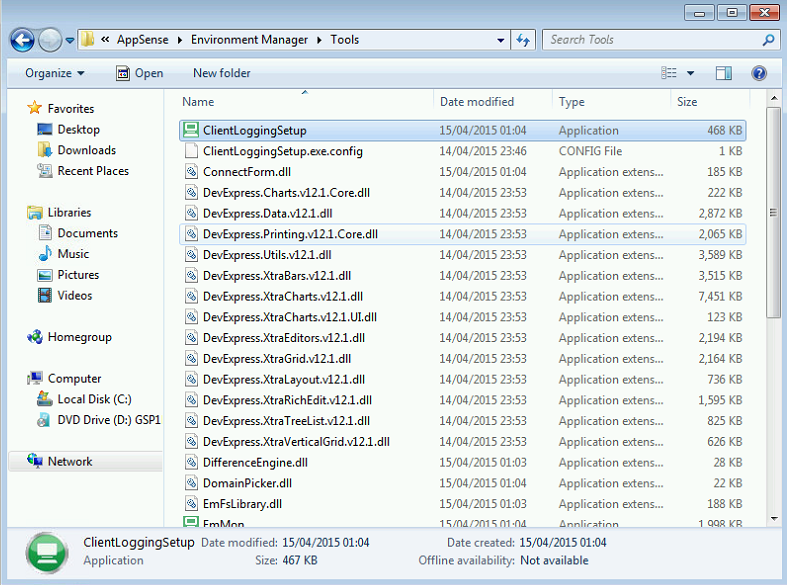
Now that the tools are installed on the server, assuming your endpoints are also x64 (because no-one still has x86 application servers, do they?), you can simply browse to the system drive of the server and run the debugging tool directly. Go across to the following path (where ServerName matches your server with the tools installed)…
\\ServerName\c$\Program Files\AppSense\Environment Manager\Tools
…and simply run the ClientLoggingSetup executable (if you’re not an administrator on the endpoint, you’ll need to Shift+right-click and choose Run As Different User)
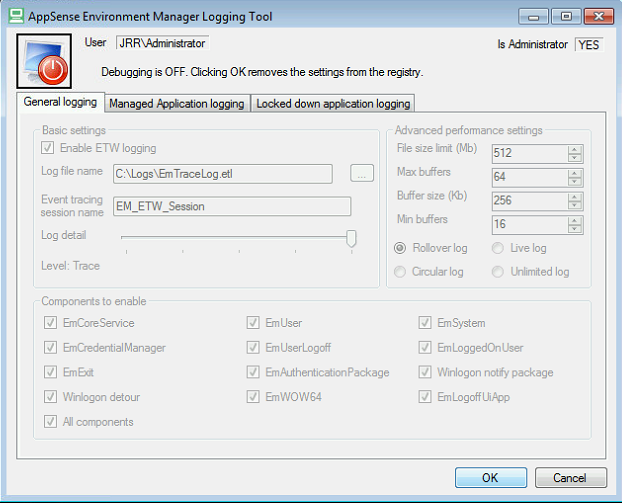
The interface you’re presented with will seem somewhat familiar, if you’re used to the old EMClientDebugSetup tool.
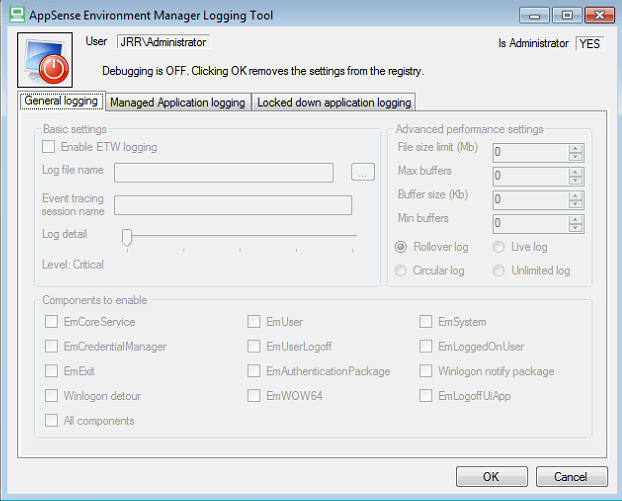
Clicking on the “big button” will turn the logging on as you’d expect…
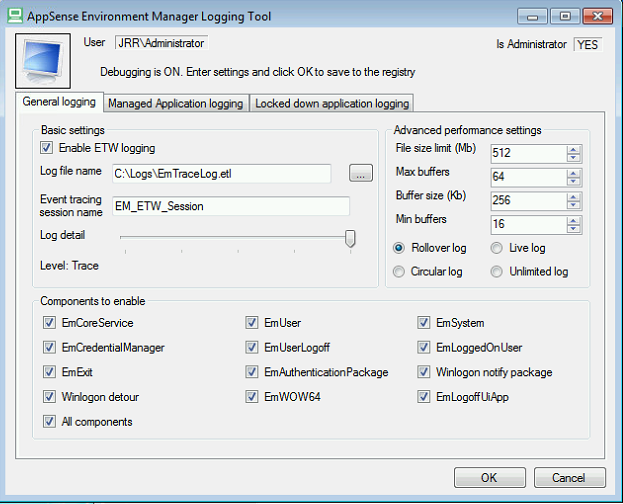
…but with some major differences. We’re now logging out to the familiar ETL trace file format which allows us to manipulate the logs in many different log collection tools, and we can set a whole host of customizable options, from file and buffer sizes to log types to granular trace controls. You can choose to log out as much or as little as necessary, even concentrating on lockdown or managed apps if you prefer. Unless you want to drown in logging, though, I’d advise keeping the detail to Trace unless advised otherwise by support.
You’ll also notice that the default directory is now c:\Logs, instead of having to always supply a logfile folder. Clicking on OK commits the settings and starts the logging process, so we will do this with the default settings active and apply a configuration that we know will generate some errors when the user logs in (some errant drive mappings should do the trick).
Once we’ve logged in with our erroneous configuration, it makes sense to stop the trace log. Browse back to the network path where the EM Tools are installed and run the executable again.
Click the big button and then click on OK to commit the changes and stop the debug trace.
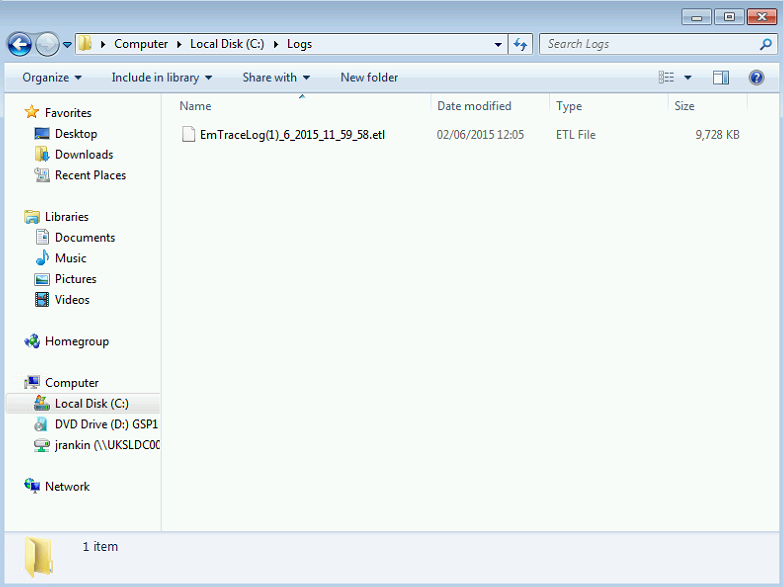
Now, we should see a log file in the c:\Logs folder.
Unlike the old-style debug tool, though, you can’t just crack ETL files open in a text editor. We need to go back to the folder which held the EM Tools install, and this time open up the executable called EmMon.exe (EM Monitor). This will also run remotely despite not being installed, handily.
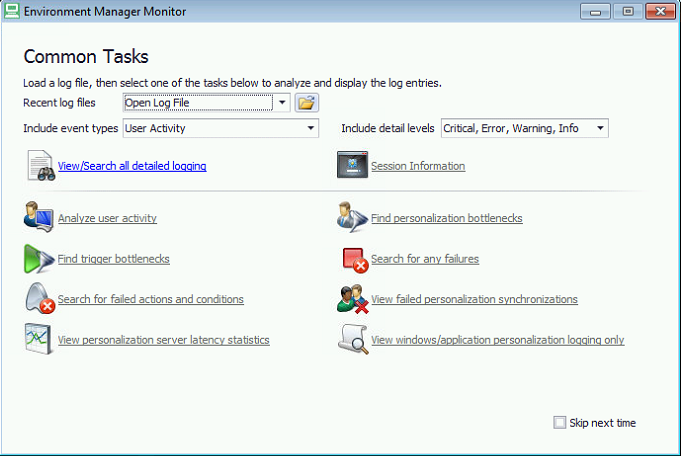
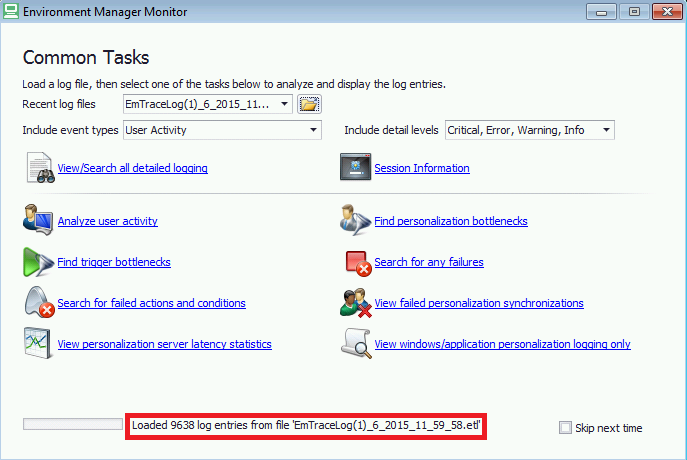
We can open up the log file by clicking on the yellow icon next to the legend saying “Open log file“. Browse to the file in c:\Logs and select it, after which you should see the interface loading the file.
You can pull out the pertinent pieces of the logfile by clicking on one of the ready-made report links, but the two you will probably be most concerned with in day-to-day admin are “Search for failed actions and conditions” and “Search for any failures“. Let’s give one of these a try and see what we see…
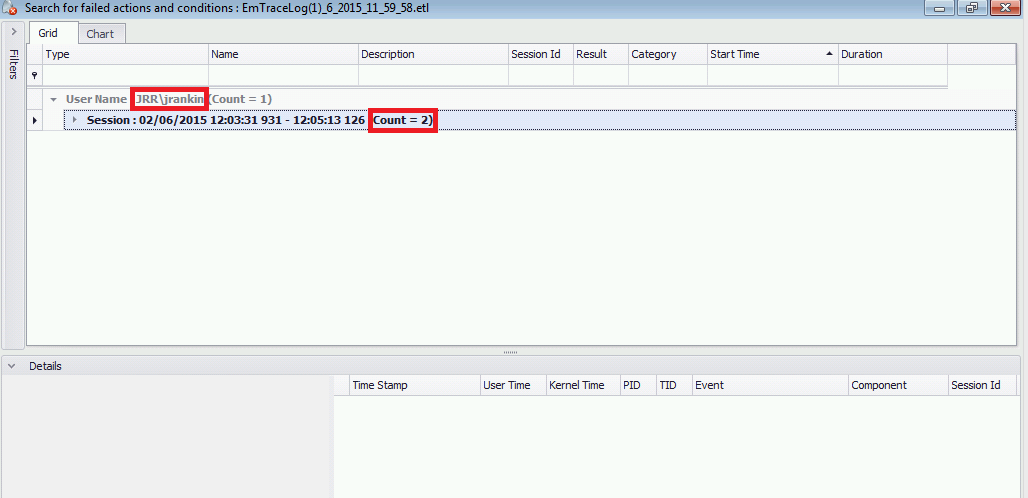
Straight away we can see the user listed and the failure counts. We can expand the failure counts to see more details…
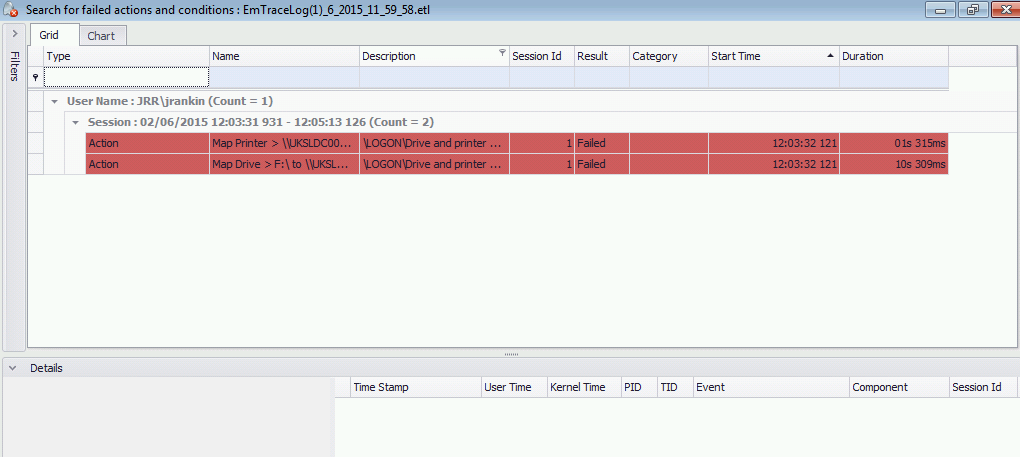
…and then highlight each one to see exactly what went wrong.
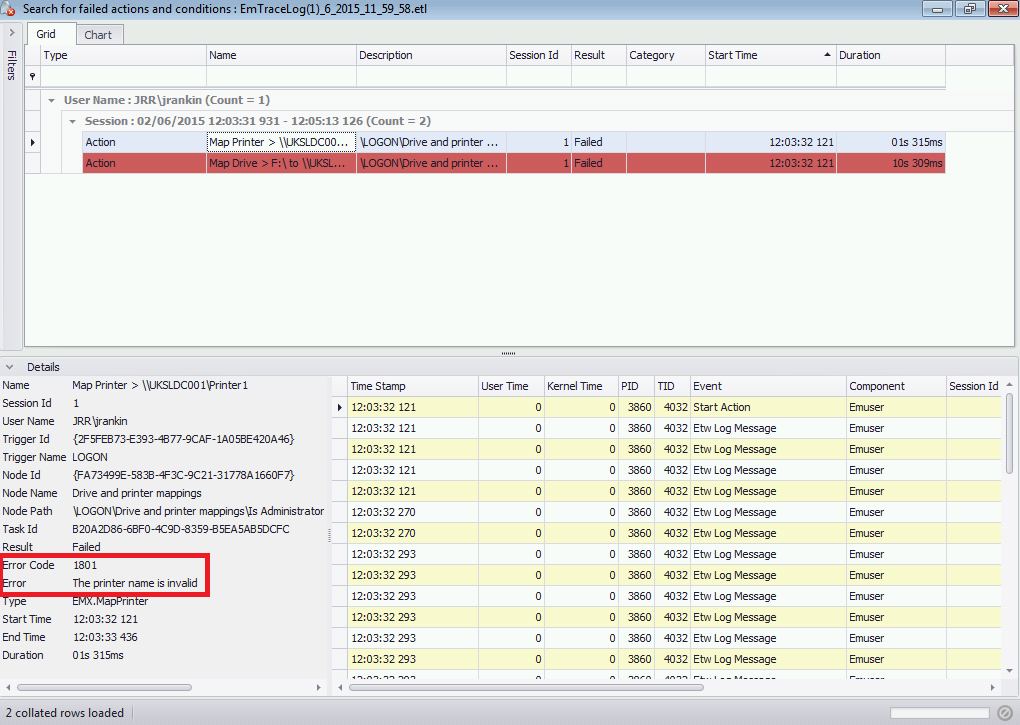
In this case, our printer mapping failed because of an invalid printer name. Nice and easy! Also, in the last two images, note the timeout for the second error (an invalid drive mapping) – more than 10 seconds! Not really something we want to see a lot of in our configs, so we can see the value.
So, the debug process hasn’t really changed that much from how we do it – but we now have more power, more detail, a standard file format, no service restart required, built-in reporting functions, and full event log integration. Previously you might find yourself digging through masses of events, struggling to set up filters, and generally getting confused, but everything is now much more streamlined and to-the-point. This is a long overdue revamp for the debug utility to go along with all of the other new features in EM 8 FR 6 – new features which hopefully will be among the subjects I shall be covering very soon as I try to push out at least two new blog articles a week!